Consolidation takes root among miners: Top 40 – 2020 edition

Barrick Gold’s 80%-owned Loulo mine in Mali. Credit: Barrick Gold
As we kick off our 42nd annual Top 40 round up of miners in Canada, this year’s numbers speak to some of the major news stories of the past few years. Underlying these is the theme of consolidation among some of the biggest companies, which, over the past few years grew considerably through mergers and acquisitions and generate the bulk of the revenues in our analysis. We will continue to watch this trend as 2020 unfolds and a pandemic-driven gold rally spurs M&A among intermediate and junior miners to see whether the revenue distribution shifts amongst industry players.
The biggest addition to this year’s list is Newmont, following its US$10-billion acquisition of Goldcorp, which closed in April 2019. The gold miner now holds operating mines in Canada and thus meets the criteria for our list, despite its U.S.-based headquarters.
Notable departures include North American Palladium, where a turnaround at its Lac des Îles mine coupled with an upswing in palladium prices spurred a $1-billion cash bid from South Africa’s Impala Platinum by October. Imperial Metals is another company leaving our roundup, as the miner sold a 70% stake in its Red Chris open pit to Australia’s Newcrest in August for US$807 million and its revenues from last year don’t meet our Top 40 cutoff. As a result of this transaction, the company classified Red Chris as a discontinued operation for both the eight-and-a-half month period in 2019 as well as 2018 and restated income statements, which, in retrospect, would also impact the company’s position on our ranking last year.

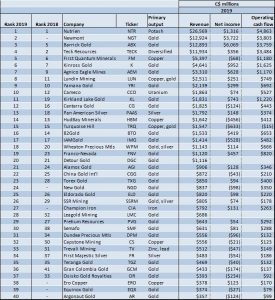
Top 40 chart
Nutrien tops the list – again
Last year, potash continued to hold the top spot, with Nutrien coming in first for the second year in a row with $26.6 billion in reported revenues. The company was formed in January 2018 as a result of a $36-billion merger between Agrium and Potash Corp. of Saskatchewan.
From here, gold producers take over the next two spots – Newmont, followed by Barrick, with the two reporting nearly identical headline revenues of just under $13 billion – see Figure 1 for a visual representation of the 40 revenue numbers.
Like Newmont, Barrick has also grown significantly over the past two years, as in September 2018, it announced plans to merge with African-focused Randgold Resources. The deal, valued at US$18 billion, closed at the beginning of January 2019.
In addition to these larger transactions, in July, Newmont and Barrick formed a joint venture in Nevada – Nevada Gold Mines – where both miners generate a substantial portion of their production from multiple assets. This came as a result of Barrick’s hostile bid for Newmont, which it launched shortly after the Newmont-Goldcorp tieup was announced. Although this bid was ultimately rejected, the two agreed to join forces across most of their assets in the state.
Interestingly, the revenue growth between 2018 and 2019 for both ‘Newmont 2.0’ and ‘Barrick 2.0’ was nearly identical, at just over 37%.
Rounding out the top five are two (primarily) base metals producers – Teck Resources with revenues of $11.9 billion, followed by First Quantum Minerals, with $5.4 billion in sales. Impressively, it is these top five companies that generated over 60% of the total revenues in our Top 40 list. From here, the remainder of the top 10 includes three gold producers (Kinross Gold, Agnico Eagle Mines and Yamana Gold), one diversified miner – Lundin Mining – and Cameco, a uranium company.

Revenue moves
Year-on-year revenue moves driven by both fundamentals and M&A
When looking at substantial numbers, context is often helpful, and this is where comparing numbers against last year’s can shed some light on corporate developments. We note that this year, we have chosen a slightly different methodology for the Top 40 – oilsands producers are in a separate table, outside of the main ranking – and that a handful of companies restated their 2018 revenue numbers, which could affect last year’s rankings.
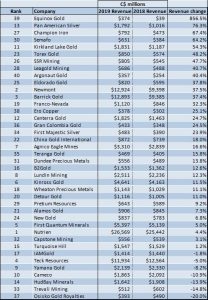
When comparing year-on-year changes in revenue, the standout is Equinox Gold – a company new to our ‘Top 40’- with revenues increasing almost tenfold, to $374 million from $39 million in 2018. A full year of production from the Mesquite open pit as well as the Aurizona mine, which achieved commercial production in July, led to this upswing (see page 29).
Pan American Silver is another major revenue mover, with sales increasing to $1.8 billion, up 76% over the prior year. This company’s 2019 financials were largely propelled by M&A, with the closing of a US$1-billion acquisition of Tahoe Resources in February 2019.
Production growth from existing mines drove year-on-year revenue increases for Kirkland Lake Gold, Champion Iron Mines and Torex Gold Resources. New mines inched sales higher for both Semafo and SSR Mining, with 2019 representing the first full year of production for both the Boungou and Puna operations, respectively.
Also along the revenue spectrum, some companies did not record major moves year-on-year. Notably, the five “Runners-up” companies that meet the criteria for the Top 40 but just miss the revenue mark, all reported headline sales for 2019 within $15 million of those from the year prior. These include Golden Star Resources, a gold miner with two mines in Ghana, Fortuna Silver with mines in Mexico and Peru, as well as three base metals miners – Taseko Mines, Sierra Metals and Copper Mountain Mining.

Ratios
Revenues don’t always translate into profits
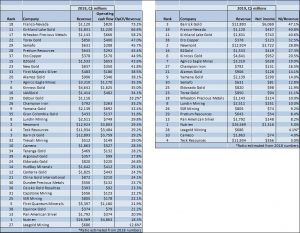
Headline revenue numbers are in no way a measure of a company’s profitability. The traditional net income measure is one; cash flow generated from operations is another metric that can help assess mines’ performance before the impacts of major non-cash items. We have chosen to analyze two ratios to assess financial performance – net income to revenue (known as the net profit margin), as well as cash flow from operations to revenues (operating cash flow to sales ratio), as shown in Tables X and Y.
Looking at net profit margins, last year, Barrick was the standout in our ranking, reporting 47% of its revenues into net income. Newmont, Barrick’s closest production peer, reported a net profit margin of 28.8%.
We took a deeper look into the companies’ income statements for the year to gain some more insight on this difference in margins and noticed that substantial non-cash items increased the reported net incomes for both companies. For Barrick, these include a US$1.9-billion gain from a remeasurement of the value of the Turquoise Ridge mine, part of the Nevada Gold Mines partnership with Newmont, following its contribution to the JV. A US$1.4-billion impairment reversal further increased the company’s net income for the year. Newmont also recorded a US$2.4-billion gain on the formation of the Nevada Gold Mines JV.
We therefore expect that Barrick’s relative margin outperformance was, in part, driven by larger one-time items than those recorded by Newmont. Overall, we believe that the 2020 financial statements, reflecting the first full year of operations of the Nevada JV, will provide a more accurate representation of the two companies’ financial performance. In the meantime, we have compiled a brief overview and comparison of the two companies (See Page 25).
The next two closest runners up – Franco-Nevada, a royalty and streaming company, as well as gold miner Kirkland Lake Gold both generated net profit margins of just over 40%. Ero Copper, which generates the majority of its production from the MCSA copper mining complex in Brazil’s Bahia State, translated 33% of revenues into net income. Newmont and B2Gold reported net profit margins of 29% and 27%, respectively.
With respect to operating cash flow to sales, royalty and streaming companies top our list, with Franco-Nevada and Wheaton Precious Metals coming in first and third, with ratios of 73% and 58%. Under the cash flow metric, Kirkland Lake Gold again emerges as a strong performer, coming in second with an operating cash flow to sales ratio of 67%. Torex Gold, which operates the El Limon Guajes complex in Mexico, is fourth, reporting 47% of revenues into cash flow from operations. Moving down the list, Semafo, Pretium and Ero Copper all generated operating cash flow to sales ratios of approximately 45%.
Watching industry moves and impacts in 2020
We close out this roundup watching precious metals prices take off as investors brace for the long-term financial impacts of the COVID-19 pandemic. While the major theme of last year’s numbers is a concentration of revenue amongst some of the largest players, in 2020 thus far, several M&A deals among some of the smaller miners have either closed or been announced.
These include Kirkland Lake Gold’s $4.9-billion acquisition of Detour Gold, which closed at the end of January. Also in January, Equinox Gold closed on a $770-million acquisition of Leagold. Other deals announced this year include the merger of Argonaut Gold and Alio Gold, West Africa-focused Endeavour Mining’s $1-billion purchase of Semafo as well as the merger between SSR Mining and Alacer Gold.
While revenues matter, they are not the only metric that investors look at when analyzing companies. As some of our numbers show, intermediate miners can generate strong returns, both in terms of income as well as cash flow. However, while true pre-production developers are traditionally single-asset companies, most of the top performing producers are not. From the recent deals, we gather that a diverse group of robust producing assets is expected to diversify technical and geopolitical risk and bring operational and financial synergies. However, both meaningful revenues and strong ratio-based performance are important for mining companies looking to create long-term shareholder value.
We wrap up this year’s Top 40 watching the ongoing M&A and looking to see how transactions within the sector move our ranking and impact profits.
Newmont: U.S.-based miner enters Canada
Given that this year is Newmont’s first appearance on our Top 40 list, we’ve decided to include an overview of the company alongside a brief comparison with Barrick, its closest peer in the major gold mining space.
Newmont was founded in 1921 and has evolved into one of the world’s largest mineral companies with a market capitalization estimated at $65.5 billion and operations across the Americas, Australia and Africa.
Over the next decade, Newmont expects to produce 6 million oz. to 7 million oz. of gold annually with an additional 1.2 million oz. to 1.4 million oz. of gold-equivalent output anticipated each year. The company’s gold reserve base totals 96 million oz.
The miner holds eight assets that it defines as “world-class,” based on annual output of over 500,000 gold-equivalent oz. at all-in sustaining costs of under US$900 per oz., a mine life of over 10 years and location in a top-tier mining jurisdiction (based on credit agency ratings). Operating mines in this category include assets within the Nevada Gold Mines joint venture, where it holds a 38.5% interest, the Penasquito open pit in Mexico as well as a 40% interest in the Pueblo Viejo joint venture in the Dominican Republic (Barrick holds the 60% stake).
After closing the US$10-billion acquisition of Goldcorp in April of last year, Newmont now holds three operating units in Canada. These include the Éléonore mine in northern Quebec, the Musselwhite operation in Ontario as well as the Porcupine complex in Timmins, where ores from a mining operation in the city and from the Borden underground mine, which is 160 km away and achieved commercial production in October, are processed at the Dome facility.
Canadian-born Barrick focuses on Nevada, Africa
Barrick Gold, one of Canada’s best-known mining companies was founded in 1983. Today, the company has a market capitalization of approximately $58.5 billion and holds copper and gold assets in the Americas, Africa, Papua New Guinea and Saudi Arabia.
The company released its 10-year plan in March: it aims to produce approximately 5 million oz. of gold a year between 2020 and 2029. Roughly half of this is expected to come from the company’s North American assets, about 1.5 million oz. of gold a year from mines in Africa, and the remaining 1 million oz. from its Latin American and Asia-Pacific assets.
Similar to Newmont, the company’s business model is built around the concept of a “Tier One” gold asset, with annual production of at least 500,000 oz. at life-of-mine total cash costs in the lower half of the industry’s cost curve and a mine life of over 10 years.
Barrick’s Tier One mines include operations within the Nevada Gold Mines joint venture, where it holds a 61.5% stake, the 80%–owned Loulo-Gounkoto complex in western Mali and the Kibali mine in the Democratic Republic of the Congo, in which it has a 45% interest.
After closing the US$18-billion Randgold acquisition in January 2019, the company added the Loulo-Gounkoto and Morila mines in Mali to its portfolio, the Tongon open pit in Côte d’Ivoire as well as Kibali.
Just as Newmont enters the Canadian mining realm, Barrick appears to be gradually decreasing its share of revenues from the country. In November, the miner announced that it was looking to modernize and upgrade its open-pit and underground Hemlo operation in northern Ontario into a Tier 2 asset. To do so, it would be looking to transition to a smaller, more profitable underground-only operation and switch to contract mining.
The fine print
We recognize that revenues are an imperfect way of looking at companies, as they discount the value of near-term expansions and development projects. Since the cutoff for our Top 40 can be very close, we have also included a runners-up table to highlight other companies generating strong revenues. Please see above for the criteria for our Top 40 eligibility, which is unchanged from past years.
Rankings between this year and last are not directly comparable: oilsands producers are outside of the main ranking (see page 23), and a handful of companies have restated revenues after the publication of last year’s Top 40.
For comparability, cash flow from operations is after changes in working capital across the companies. For two of the companies on our list, Detour and Leagold, their respective acquisitions closed before the publication of full-year financials. We have estimated revenues for the fourth quarter based on production (or sales, if available) and average commodity prices and exchange rates for the period.
Lastly, financial results are largely impacted by commodity prices and exchange rates. Given the predominance of gold miners within our ranking, we provide a price comparison for the yellow metal: in 2019, the gold price averaged US$1,393 per oz., while in 2018 it averaged US$1,269 per oz. The U.S. dollar cost $1.33 in 2019 and $1.30 in 2018.


Comments