COSTMINE: Yes, costs have risen

Inflation in the U.S., for the 12 months ending October 2022, was 7.7%. For the same period, inflation in Canada was 6.9%. Australia saw a 7.3% increase. These are not the kinds of inflation figures that anyone wants to see, but they are our current reality, and we must deal with their effects. What do those effects look like for the mining industry? Without question, costs have risen, but how much have they escalated? Has it been a gradual climb or a dramatic shift?
To dive into these questions a bit more, this brief article highlights the capital and operating costs for a sampling of mining equipment over the period 2016 through 2022. As the author, I thought it would be an interesting exercise to examine costs over this arbitrary period because it corresponds to the period for which I have overseen Costmine’s mine supplies and equipment cost databases. The costs were obtained for the study using Costmine’s online application, Equipment Cost Calculator, which is updated annually in the fall. All currency values are in U.S. dollars.
The pieces of equipment examined are as follows:
> Rigid frame haul truck: 100-tonne class
> 20-tonne diesel locomotive for underground haulage
> 91-cm wide portable jump belt conveyor, inclusive of motor and designed to 100 lb/cu ft material
> 150 to 300 t/h air separator, inclusive of motor and exclusive of liner (For the years 2016-19, the capital costs did not include motors. To bring the costs in line with later years, the author added a flat $50,000 to the cost of the machine for a 300 hp AC motor).
As you will note in the following charts, there are plots for capital costs on both a dollar basis as well as a per cent change basis. Several of the figures also represent operating costs broken into the following categories: overhaul plus maintenance labour, diesel fuel or electric power (as appropriate), and “other” operating costs. The “other” category comprises tires, wear parts, maintenance and repair parts, lube, and natural gas. This breakdown only highlights common categories of interest. It is important to note that operators are not included in hourly operating costs. These costs are for the machine only.
Observations
1. Capital costs
The capital costs for the selected equipment are illustrated in Figure 1 over the specified period. We can observe that costs remained flat for all but the diesel locomotive over the first three years of the study period. The locomotive during this time saw only a minor, but consistent, increase in cost. We can also see that the haul truck kicked off an upward trend in pricing in 2019, with the air separator and locomotive following suit in 2020.
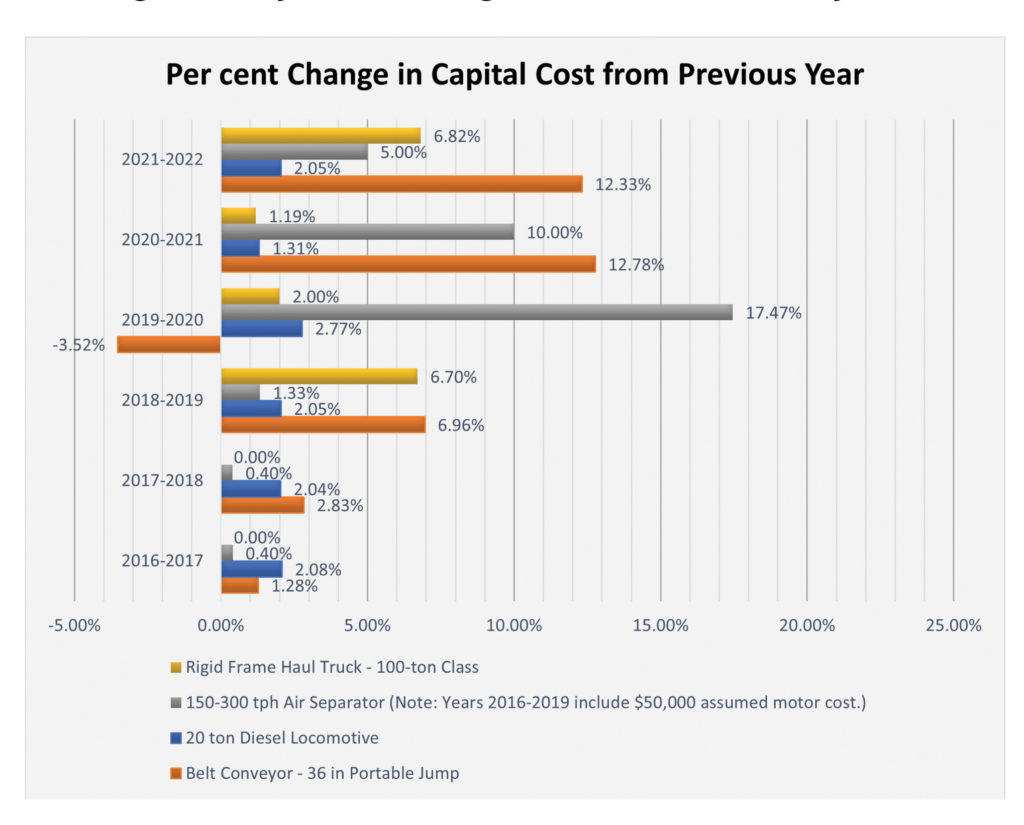
The capital cost trends may be better depicted by Figure 2, which represents the year-over-year per cent change in costs for the selected equipment. This figure shows an accelerated upward growth in prices in the latter half of the seven-year window for most items. There are two exceptions, with the first being a one-year drop in price for the conveyor going into 2020 and the second being a consistent annual increase for the locomotives across the full seven-year time frame. It is also notable that the conveyor has seen the largest cost increases on a percentage basis over much of the 7-year time frame. It is eclipsed only by the locomotive in 2017 and by all pieces in 2020 due to it being the only item seeing a reduced cost that year.
Figure 2: Per cent change in capital cost from previous year.
Finally, while the cumulative tally for all equipment pieces in 2022 is $2,700,100 versus $2,224,555 in 2016, it is clear in both capital cost figures that costs did not change uniformly for all equipment types over the period studied. We will discuss more about this below.
2. Operating costs
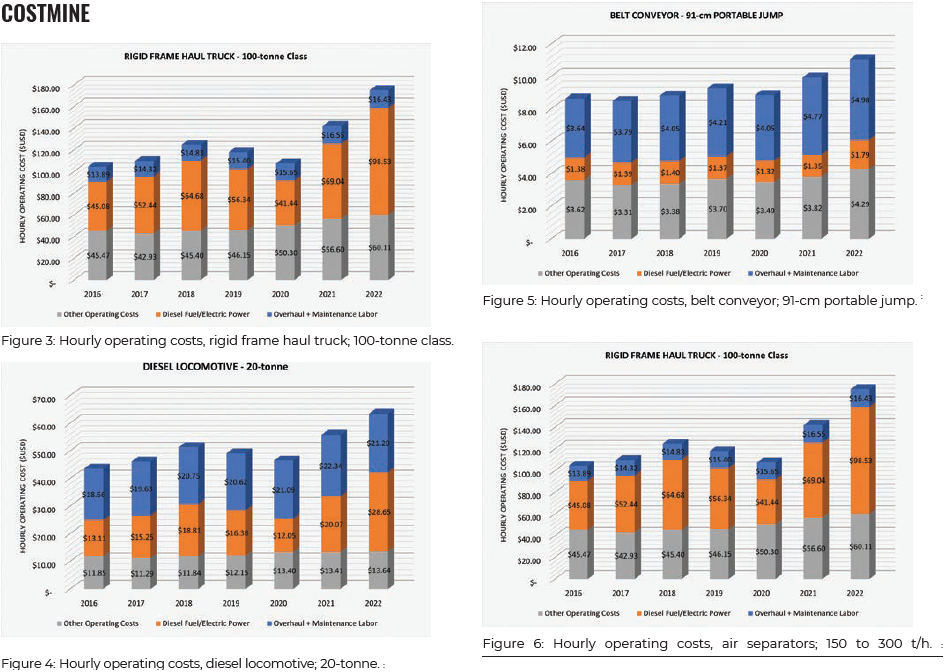
For the selected equipment and operating cost categories, diesel fuel is the most variable of costs for the 2016 to 2022 period. This is clearly demonstrated in Figures 3 and 4, where the total hourly operating cost fluctuations closely follow the rise and fall of the hourly diesel cost proportion. Moreover, we can see that the truck and locomotive have a similar pattern in their operating cost profiles.
Figure 3: Hourly operating costs, rigid frame haul truck; 100-tonne class.
Figure 4: Hourly operating costs, diesel locomotive; 20-tonne. :
Conversely, electric power (grid sourced) is shown to be the most stable category for the selected equipment. For example, if we examine the belt conveyor chart in Figure 5, we see that the cost per hour for electricity from 2016 to 2021 did not change by more than $0.05/hour for any given year, or 3.7% from one year to the next. A similar scenario is observed in Figure 6, where the cost per hour for power required to operate the air separator deviated no more than $0.44/hour, or 3.2%. A significant increase in utility power for 2022 deviates from this trend at the end of the 7-year period.
The labour costs associated with overhauls and maintenance increased over the seven years ending in 2022. The average increase across the four equipment types is 31.6%.
Discussion and insights
1. Capital costs
As noted above, the capital costs for the selected equipment did not change uniformly over the study period. This, of course, is due in part to the disparate nature of the chosen equipment across both the mining and processing tasks, but it is also largely the result of manufacturer uncertainty regarding the global pandemic and other coincident issues related to transport logistics and raw material supplies. The culmination of these issues has made it difficult for manufacturers to set and maintain reliable pricing structures. The author has personally had many conversations with data contributors that highlighted an initial resistance to raise prices, with the thought that underlying cost pressures would ease. As we see from all the figures above, however, manufacturers can suffer reduced margins for only so long before they must raise prices to bring them back in line with underlying costs.
As estimators in the mining industry, we all know that costs escalate over time and that it is best to avoid delays in development decisions. The data in this article drive this point home, with the costs for developing a project today being higher than it would have been just three to four years ago.
2. Operating costs
Global events and government policy can bring uncertainty to the diesel supply chain, resulting in prices that rise and fall as quickly as the tides. In turn, the costs to operate your mobile fleet (or to power your remote mine) can vary wildly. The data for the diesel-powered equipment in this study confirms this. At the other end of the spectrum, electric power costs can remain steady when serviced by the utility grid. Might the estimator view this as an additional argument for electrification beyond those arguments tied to ESG?
As one might expect, the labour costs associated with keeping the machines running increased over the study period. It is notable however that the proportion of labour costs relative to the total hourly operating cost did not change for any equipment item. This is because operating costs such as diesel, or items within the “other” category, offset the labour adjustments. Cost estimators should consider these types of relationships whenever they conduct trade-off studies focused on future operating cost expenditures.
Brad Terhune is a cost analyst and senior geologist with Costmine (www.costmine.com).
Related Posts
Etruscus advances large-scale rare earth target at Rock and Roll property
Burgundy releases 2024 socio-economic report on Ekati diamond mine

Upcoming BEV conference to focus on developing battery materials supply chain

TNM Podcast: Communication ‘main issue’ between miners and Indigenous communities, ft CMEB’s Youcef Larbi
Comments
Jordan
Very interesting!
That first graph is misleading: one axis starts at zero while the other starts at 1M USD. It would be better to show the % increase, indexed to 2016 dollars.